2. Counting and diagnosis of ventricular fibrillation (new Microport platform)
Case Summary
0 of 1 Questions completed
Questions:
Information
You have already completed the case before. Hence you can not start it again.
Case is loading…
You must sign in or sign up to start the case.
You must first complete the following:
Results
Results
Time has elapsed
Catégories
- Pas classé 0%
-
Interpretation:
Tachogram
- The patient is in 1:1, then at 20:14:25, a tachycardia occurs with ventricular cycles (red dots) in the VF zone;
- The rhythm quickly becomes disorganized, ultra-fast,
- A 41.9 J shock is delivered.
- Return to a slow rhythm (SR).
Electrogram
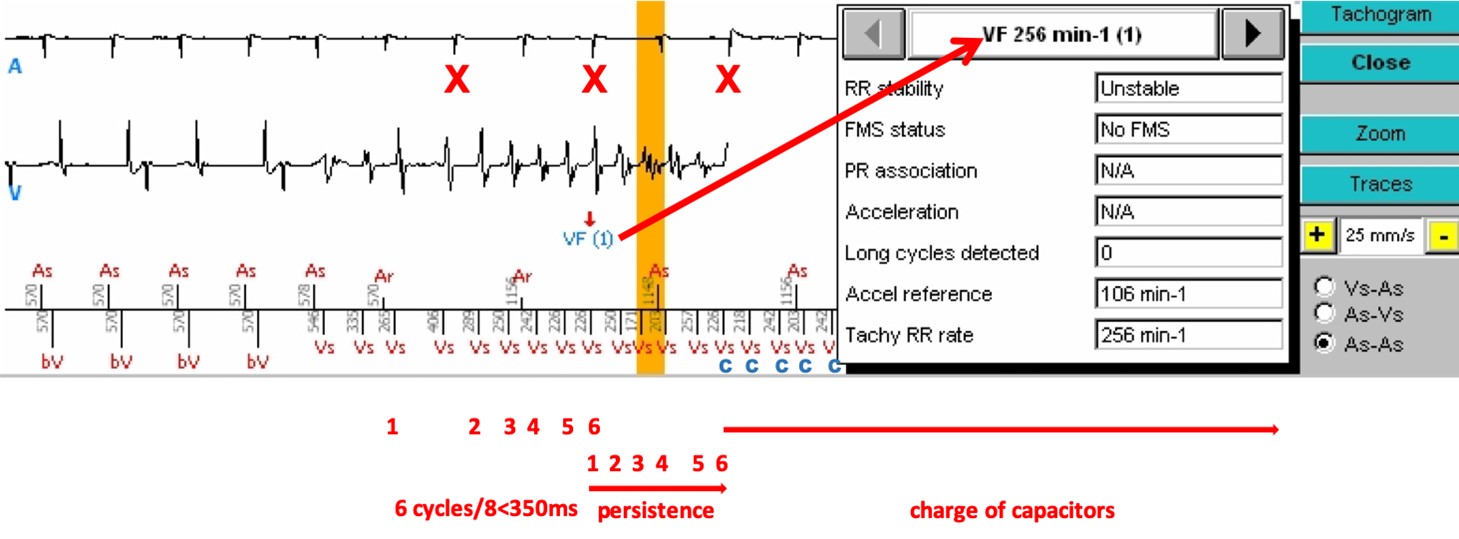
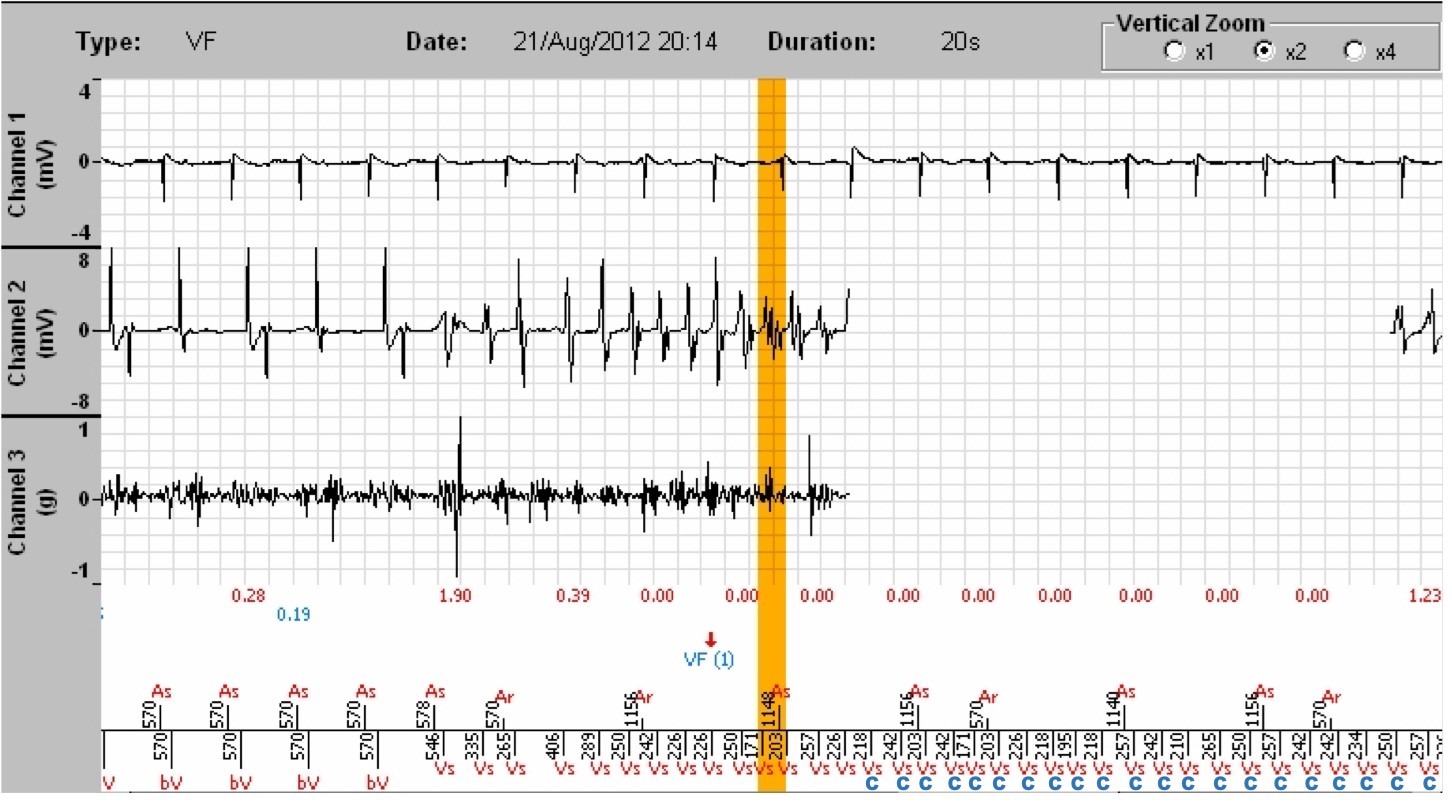
- After a synchronized atrio-biventricular (As-bV) rhythm, ventricular tachycardia begins, well detected (Vs), with not all P waves being visible, since some fall into the post-ventricular atrial blanking (red crosses (X)). At least 6/8 cycles are in the VF zone, a VF is diagnosed (VF (1), arrow). By clicking on « Analysis » on the right side of the tracing, under Tachogram, and selecting the number of the analysed marker (in this instance 1, for VF (1)), we access a table providing the status of the criteria leading to the diagnosis of VF, with a ventricular rate of 256/min.
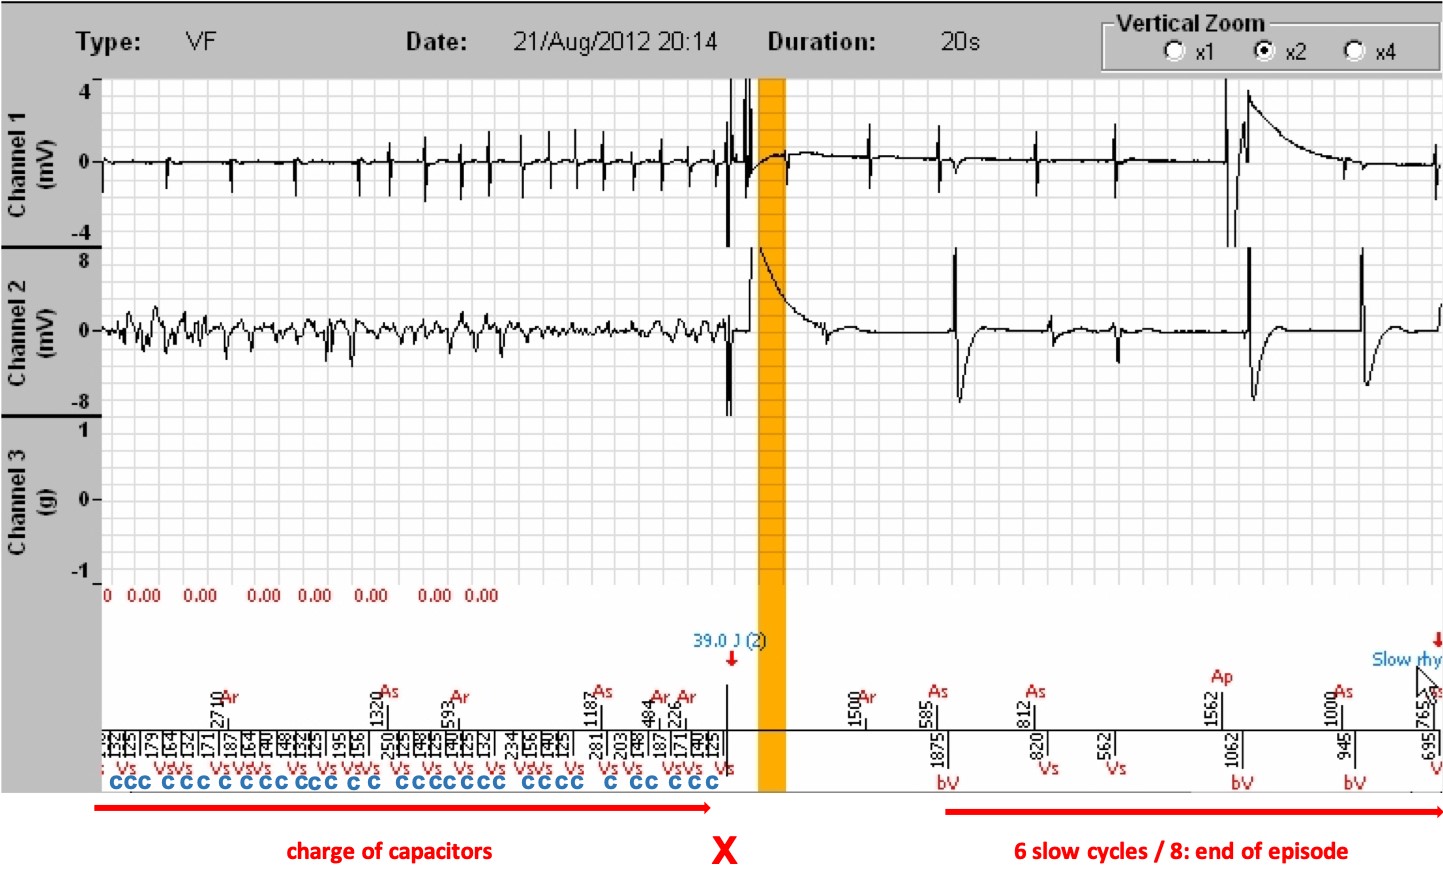
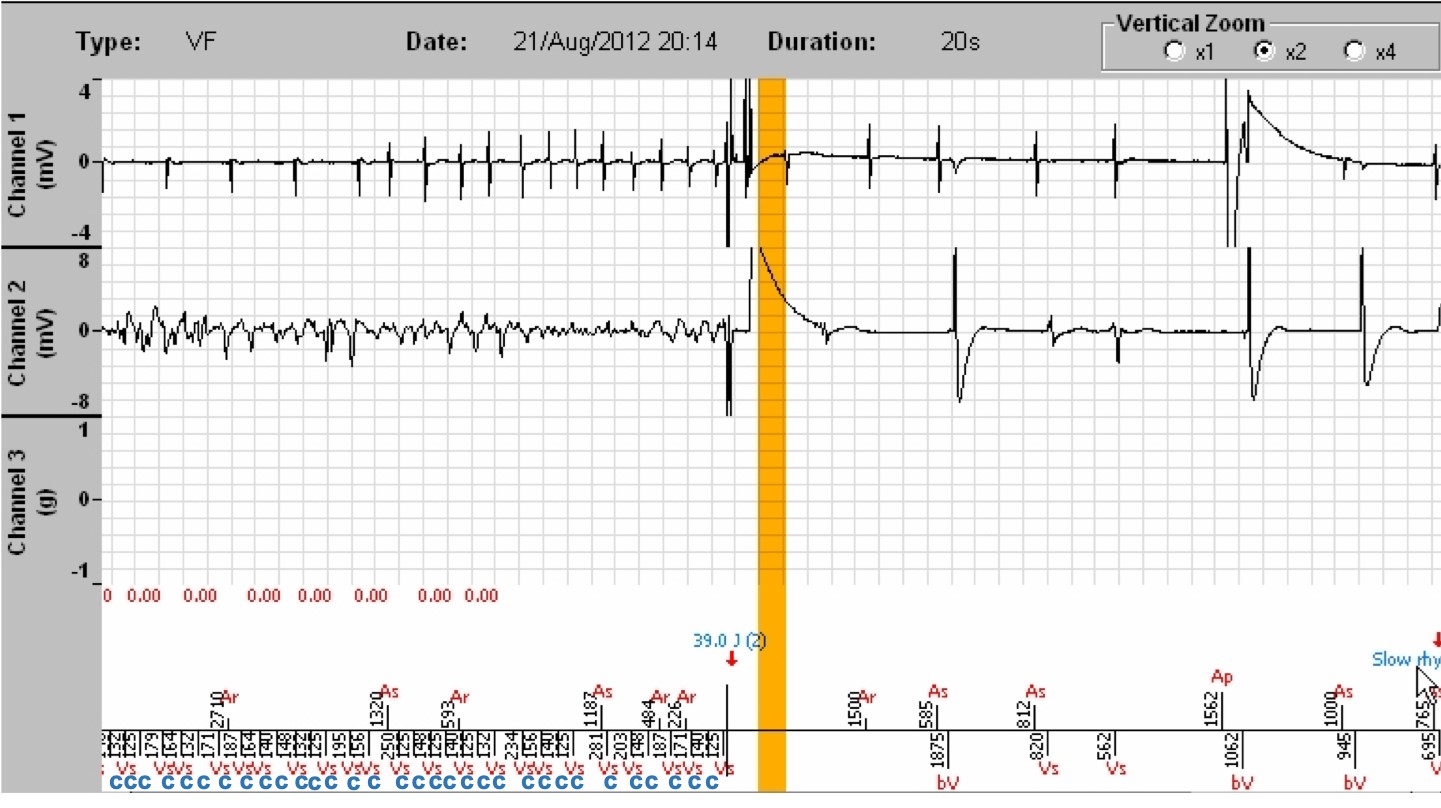
- After 6 persistence cycles (as programmed), the majority rhythm remaining that of VF, the capacitor charge is initiated. During the charge, the device continues detecting the arrhythmia, and the shock will be delivered only if the arrhythmia is still present when the programmed energy is reached, on the VF cycle following the end of charge (red cross (X)) (below). The occurrence of a Slow cycle can halt the charge. The occurrence of 6/8 Slow cycles (Slow rhythm) or a SVT/ST majority can abort the charge.
- An important note regarding the persistence counter: the VF persistence counter is independent of that of the Slow VT and VT. The device resets the persistence cycle counter only when it finds other majority rhythms, but not after applying a therapy.
- A 39.0 J shock is delivered for 42 J programmed. At the end of the charge, the patient still being in VF, the cycle on which the shock is delivered is in the VF zone, the majority analysis remains VF and the VF persistence counter also remains higher than the threshold at this particular moment. Just before the shock, we see that the atrial rhythm has become arrhythmic. Termination of the atrial and ventricular tachycardias after the shock.
- The shock impedance was 48 ohms (information obtained by clicking on « Analysis », and by selecting the number of the marker corresponding to the tracing using the arrows of the analysis table; the impedance value is also displayed in the interrogation, on the home screen)
- After a 1-second of total blanking, the cycles are slow, and the device diagnoses the termination of the episode (slow rhythm).
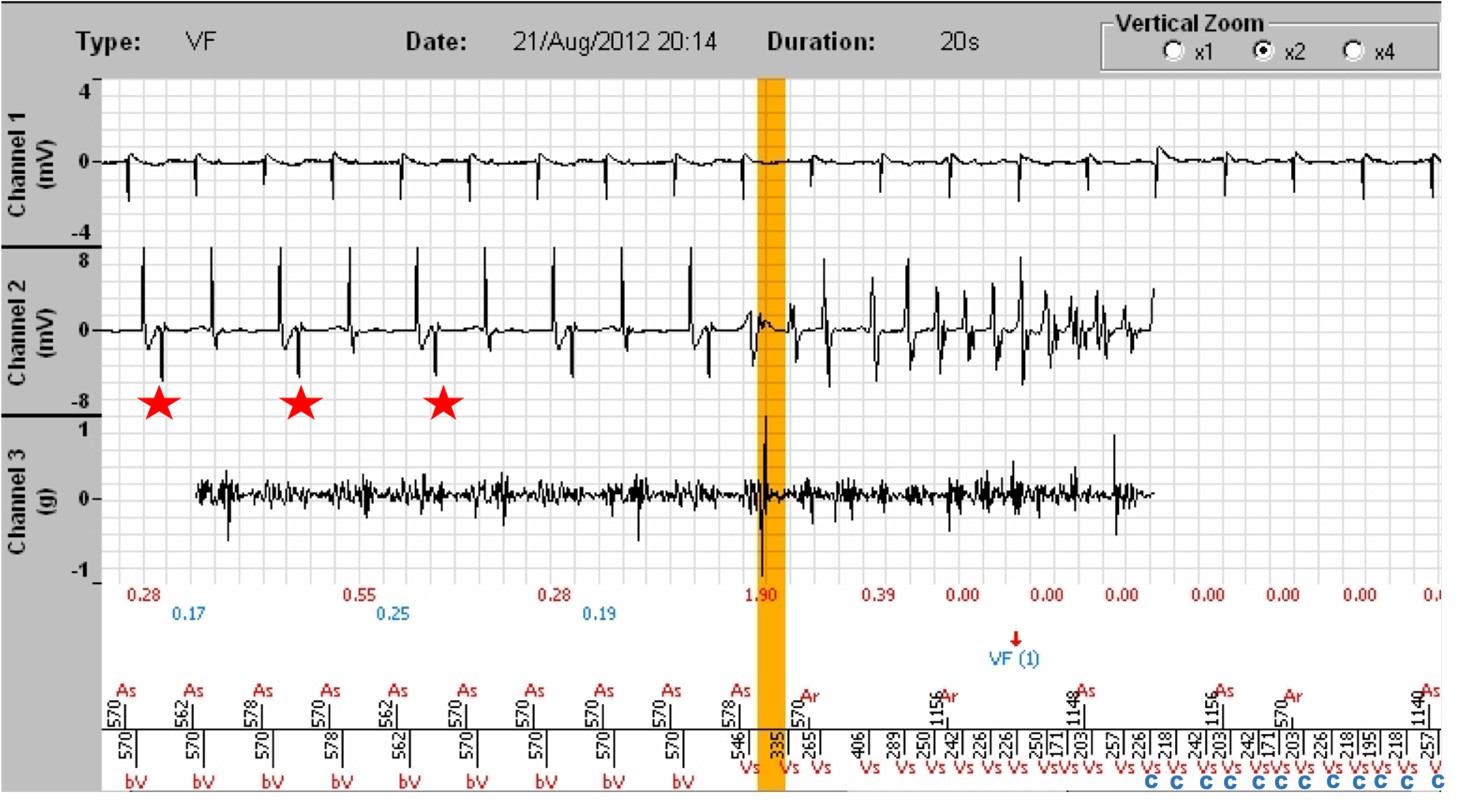
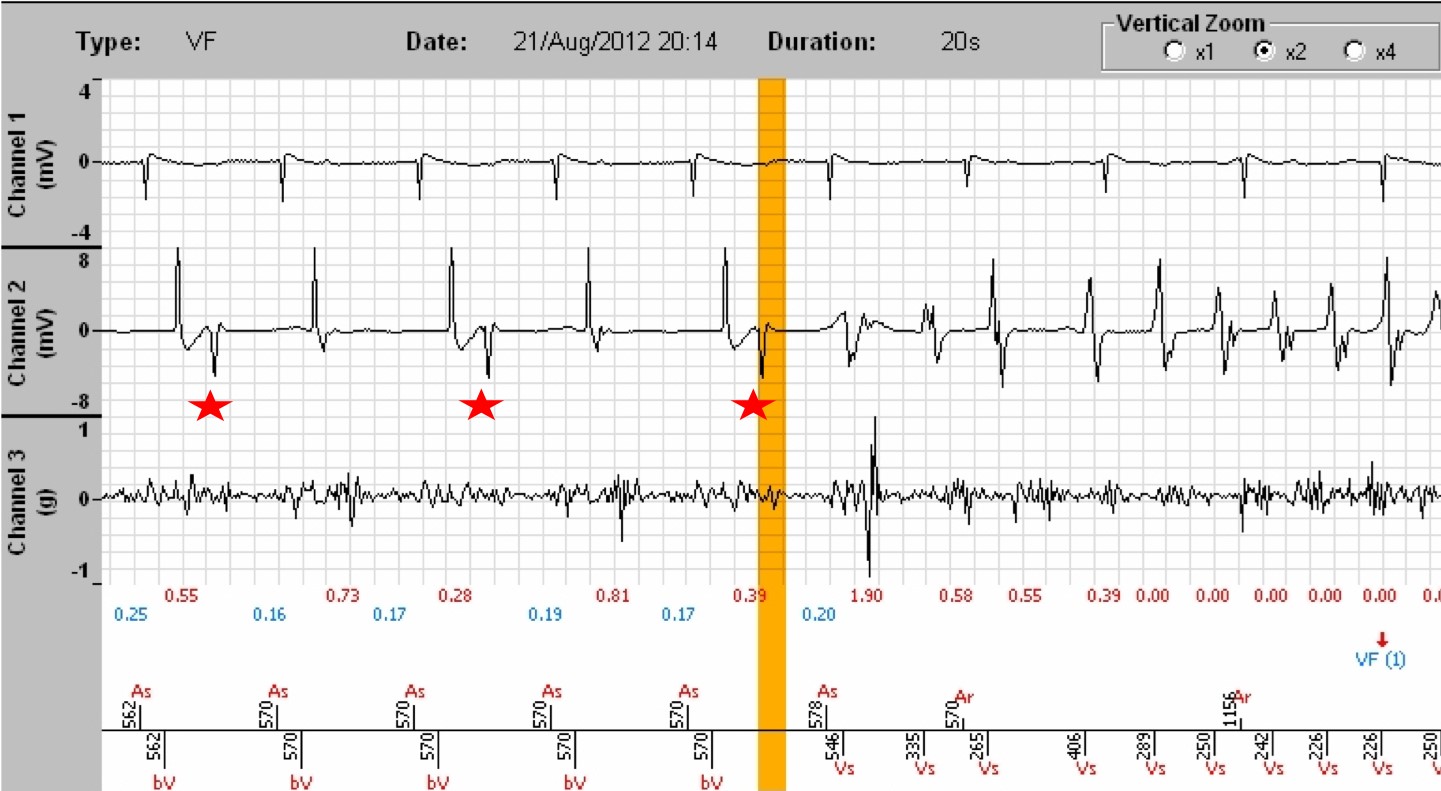
- Clicking on the « Zoom » tab allows a better reading of the EGMs. The atrial EGM is displayed on channel 1, the ventricular EGM on channel 2, and on channel 3, the SonR signal with underneath, the SonR1 value in red, the mitral closure, and in blue, those of SonR2, the aortic closure. Of note: on the one hand, the likely intermittent absence of right ventricular pacing with a RV QRS occurring remotely from the spike (red stars), in a patient with a high threshold and requiring an increase in pacing energy, as well as the collapse of the SonR1 values when one of the two leads does not work, and when the tachycardia has started (red crosses (X)) . The two tracings below are identical, the first at the scrolling speed of 25 mm/sec, the second at a scrolling speed of 50 mm/sec.
Comments:
- This tracing illustrates the basic function of a defibrillator. It very quickly diagnoses ventricular fibrillation, charges the capacitor and delivers a shock. The treatment is immediately effective with a return to sinus rhythm.
- This method of programming the defibrillator is now obsolete. Previously, it was considered necessary to act quickly and to trigger the therapies quickly. However, we have learned i) that many tachycardias, even VF, can terminate spontaneously, ii) that a therapy can always destabilize the ongoing tachycardia and render its termination more difficult thereafter, iii) that the repeated charges due to tachycardias that may have terminated spontaneously ultimately wear the defibrillator battery prematurely, and iv) that shocks are deleterious to the myocardium. Hence, nowadays, persistence values in the VF and VT zone in primary prevention would be programmed at 20 cycles.
- In this example, the detection was perfect throughout the arrhythmia. It can be seen that the programmed energy of 42 Joule is not the one delivered (39 Joule). This is true for all models, with a small difference between the two values; it is a universal principle of operation of implantable defibrillators. This is not indicative of battery wear or any malfunction.
- In this example, an anti-tachycardia pacing burst was programmed. It was not delivered because the rate of the episode was 274 per minute whereas the burst is only delivered if the rate is between 210 and 240 per minute and the rhythm is stable. It is indeed considered that beyond this range, it can only be a VF. The behaviour of the prosthesis is completely normal.
- Of note, in older Microport platforms, the charging of the capacitors is not recorded in the EGMs, making the reading difficult. The new platforms add a « C » marker for a charge on the cycles, as in the following example.
- Coronary lesions were found in this patient with ischemic heart disease which required revascularization by dilatation and stenting, as well as several closely occurring episodes of ventricular tachycardia of different morphologies, raising the prospect of VT ablation.
- Finally, it should be noted that the loss of right ventricular capture diagnosed just before the episode is not innocuous and may have favoured the start of the arrhythmia on the first initiating PVC (the coupling interval being shorter from the point of view of the right ventricle). It is imperative in this instance to adjust right ventricular pacing to the current threshold.
The counting of a tachycardia by Microport defibrillators can be broken down into:
- A diagnostic phase of a tachycardia in a given zone under the rule of at least 6/8.
- The triggering of a persistence of a programmable number of cycles.
- A final diagnosis at the end of the persistence, always according to the rule of at least 6/8.
- The conditions of delivery of a treatment: once the charge completed, on the verification cycle, the latter, the majority, as well as the persistence « are all VF » or « all VT ».
- After each therapy, a redetection for a new diagnosis.
- 6 slow cycles out of 8 induce episode termination.
- 1
- Current
- Review / Skip
- Answered
- Exact
- Inexact
-
Question 1 of 1
1. Question
Patient
A 57-year-old man was implanted in primary prevention for ischemic heart disease in the absence of infarction with an ejection fraction of 30%, with recent cardiac decompensation. The choice of a Platinium SonR CRT triple chamber model was dictated by the occurrence of a Mobitz type II second-degree AV block. When the patient is in 1:1, the PR is measured at 420 ms and the QRS reveals an intraventricular block at 120 ms. Since the patient requires continuous pacing, resynchronization has been favoured. The patient consulted after 3 shocks preceded by discomfort.
Programming
Three zones are programmed:
- a Slow monitoring zone between 140 and 170/min, with persistence of 30 cycles;
- a VT zone between 170 and 210/min, with persistence of 12 cycles, ATP and shocks,
- a VF zone above 210/min and persistence of 6 cycles, with a FVT zone with burst if VT is stable between 210 and 240, and shocks if failure, and a VF zone above 240/min with immediate shocks.
Tachogram of the last episode:
The zones are displayed on the right of the graph. The red dots represent the ventricular cycles, the blue crosses, atrial cycles. The yellow vertical bar corresponds to the EGM segment that will appear on the screen after clicking on the blue EGM button on the right of the graph.
Electrogram
Tracings: The tracing at the top is the atrial electrogram; underneath, the ventricular electrogram; lastly, at the bottom, the atrial markers above the line and ventricular markers below, along with the PP and RR time intervals. (Channel 3 displays the intracardiac accelerometer signal that will not discussed)
What is your diagnosis ?
ExactInexact


